GANTT
CHARTS
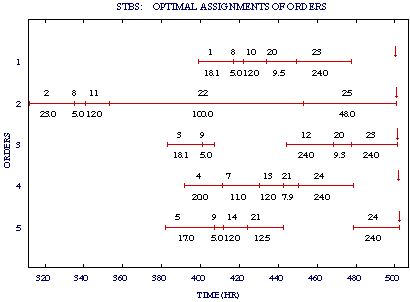
STBS interface generates automatically the
graphical output for the problems. Figure 1
illustrates the optimal assignments for the
example problem with 5 orders in 650 hours of
operation.
The arrows represent the due dates for each order
and the bars show the duration of each processing
stage. The number above the bars indicate the
unit in which the task is processed and the
number below it indicates its duration. Note that
all the orders are produced within the dates
required.
Figure 1
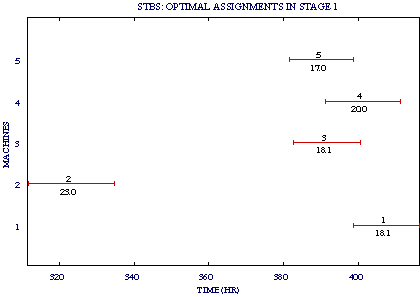
In Figure 2, the optimal assignments are shown
for the first production stage, which is composed
of units 1, 2, 3, 4 and 5. The legend above each
bar corresponds to the order processed and the
one below it is related to the duration of the
task.
Figure 2
|